axisfirst Business Software Blog
From time to time, we publish ad hoc articles here on how to get the best out of your axis diplomat system. To keep up to date on the latest articles, please follow our @axisfirst Twitter feed.
An Introduction to Monitors Part 1
First published 12th March 2015
Using Monitors as Reporting Tools
Whilst many of our customers have wholly embraced the "monitor" concept, some continue to look at traditional reports without seeing the advantages of using monitors to replace some, or all, of the reporting functions that they use.
With many of the new developments within the software being focused on improving monitors (whether that is new tab types, new filter options or additional columns), we are asked, from time to time, "what's the big deal with monitors?".
What's is the Big Deal with Monitors?
To illustrate, let's take a really simple requirement and suppose we have several customer groups and every week we want to see who are the biggest spending customers in each group so far this financial year. The groups that we are interested in are:
| Customer Group Code | Description |
| 1 | Garden Centres |
| 2 | Mail Order |
| 3 | DIY Stores |
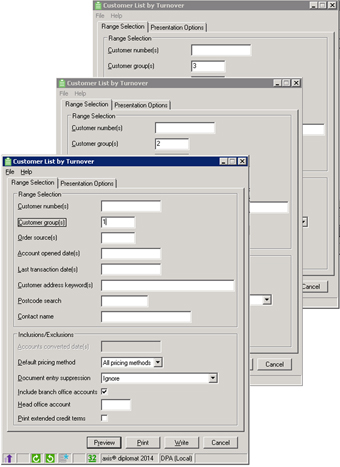
Traditionally, we would have run three "Customer List by Turnover" reports:
This would produce three reports similar to this one:
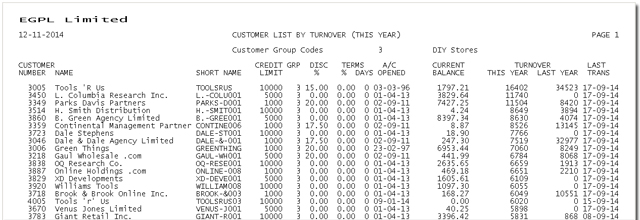
There are several downsides to this approach:
- we have to enter the selection every time (granted, remembering customer groups 1,2 and 3 every week isn't too hard but in reality, the selection criteria is likely to be more complex)
- we have to live with the report layout that was designed into the function
- we can look at the report but we can't interact with it; we can't drill down into a particular customer to see what makes up their turnover
- we cannot export the data from this report to, for example, Excel, to manipulate or analyse the data further
The Monitor Approach
A Monitor is essentially a function with one or more tabs of scrolling lists of data that updates (or refreshes) itself in the background and so shows a near-realtime view of your data.
Much of the power of the monitor functions comes from the fact that they are scrolling lists of data. The previous Software Blog Article, Getting the most from Scrolling Data Lists described many of the really useful things that you can do with this interface.
Whilst the system ships with a number of pre-configured Monitors (Sales Desk Monitor, Sales Order Monitor, Purchase Order Monitor etc.), the really neat thing is that you can create your own - either by adding tabs to an existing monitor or by creating your own monitor from scratch.
To illustrate the Monitor approach with the above example, we can create a new monitor by using the following simple steps:
- click on the Monitors icon on the toolbar
- select Create New Monitor
- enter a name for the first tab
- choose the tab type - in this case, Customers
- click on Create New Tab
- specify the filters - in this case, selecting the appropriate Customer Group
- fine-tune the results by reducing the number of columns shown in the scrolling data list and sorting by the required column(s)
- create any further tabs by clicking on the [+] tab and repeating steps 3 to 7
- save the monitor, giving it a meaningful name
The monitor is then added to your list of available monitors, along with the standard pre-configured ones, such as Sales Desk Monitor and Sales Order Monitor.
To show how easy it is in practice, we've created a video showing the whole process for the example given above.
For best results, view the video in full screen. Note: this video has no soundtrack.
The axis diplomat 2014 Kernel User Guide has an entire chapter on how to make the most of the Monitor functions within the system.
the axis diplomat blog
March 2015